Learn About The Different Types Of Eye Charts
When you visit your optometrist for a routine eye exam, odds are you interact with the Snellen Eye Chart. This is the most famous eye chart used here in the United States. The Snellen Chart is named after its creator - Dutch optometrist Hermann Snellen.
This eye chart finds its way into more than just your optometrist’s office; you may notice them in your child’s school’s nurse station or at your physician’s office.
Beyond The Snellen: 5 Different Types Of Eye Charts You Might See At An Optometrist Office
The Snellen Chart has 11 rows of capital letters; the top row has a very large letter, and the rows get proportionally smaller from there. We have you read down the rows until you can’t decipher the letters, which is a starting point for determining your visual acuity (VA), a measure of the ability of the eye to distinguish shapes and the details of objects at a given distance.
However, this isn’t the only eye chart we use here in our office during an eye exam. Depending on our patients’ age, literacy level, native language, or preexisting eye conditions, we may use one of the following eye charts.
LogMAR Chart
This chart is now considered the “gold standard” of eye charts because the LogMAR Chart achieves more accurate measurements of a person’s visual acuity.
LogMAR is an acronym for Logarithm of the Minimum Angle of Resolution. It was created in 1976 at the National Vision Research Institute of Australia. The researchers who “invented” the LogMAR chart, Ian Bailey and Jan E. Lovie-Kitchin said they created the chart so “... the typeface, size progression, size range, number of words per row and spacings were chosen in an endeavor to achieve a standardization of the test task."
The LogMAR chart functions similarly to a Snellen Chart in the sense that the first line of letters is large and then gets progressively smaller with each line. However, each line of the LogMAR Chart has five letters, which means doctors or researchers using the chart with patients can time how long it takes them to identify each letter in the line. Variances in times are then plugged into a formula to determine their visual acuity.
Tumbling E Chart
Parents are always amazed at how we can determine a child’s visual acuity and can get accurate eyeglass prescriptions - even when they can’t read. While technology is on our side, and machines do some of that, we use the Tumbling E Chart for anyone who can’t read or who reads in a language that doesn’t use our Roman characters.
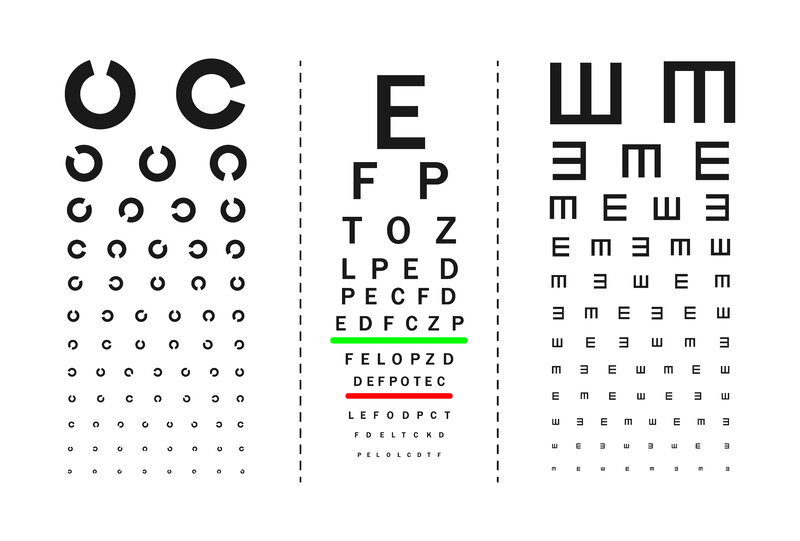
The Tumbling E Chart is similar to the Snellen or LogMAR chart. However, instead of having a variety of letters, we only use the capital letter E. The E “tumbles” or changes direction in each spot - always at 90-degree angles- and the Es decrease in size with each line. The patient uses hand gestures (up, down, left, right) to mimic how the E is positioned.
Landolt C Chart
This is another chart used to measure visual acuity in people who can’t read or who aren’t able to speak. It was invented by a Swiss ophthalmologist named Edmund Landolt. The chart's name is a bit of a misnomer because Dr. Landolt considered the shape to be a broken ring (called an optotype), not actually the letter C.
Note: Optotypes are very specific in design (unlike a typical font). The height and width of an optotype are five times thicker than the line, and the thickness of the white spaces and lines is equal.
As with the Tumbling E Chart, patients show which direction the ring opening faces. However, this test has critics because when the broken portion of the ring faces straight down (at six o’clock), it’s difficult to discern and can appear closed. For this reason, it’s not quite as accurate as other tests.
Symbol Charts
Some optometrists and ophthalmologists opt to use symbol charts in their offices rather than the Tumbling E or Landolt C. These charts have universally recognized symbols, like trees, flowers, houses, chairs, hats, etc.
Our younger patients find this far more fun than the Tumbling E or C. This is also a better option for children or adults who have motor coordination issues and aren’t able to use hand gestures to depict the change in the letter or optotype orientation accurately. There are additional symbol-based charts for children or those who can’t read letters, called LEA Charts, which use a series of shapes or numbers.
Jaeger Chart
This chart is used to help us determine a patient’s near vision. It consists of several paragraphs of text, each using different-sized fonts. Unlike the Snellen, LogMAR, and other charts, the font in each paragraph is larger than the one before it.
The first paragraph uses letters that are 0.37mm, and the final paragraph is in a typeface that is 2.5mm. Patients read these paragraphs, which are set at a fixed distance from their eyes. The goal is to ensure your glasses or contacts allow you to see clearly when reading a book or working on a computer without any serious effort or eye strain.
Overdue For Some Eye Chart Time? Visit Eye to Eye Family Vision Care
When did you last read the letters, symbols, or numbers on a standard eye chart? As simple as they are, all of these different types of eye charts are amazing for helping optometrists and ophthalmologists determine our patients’ visual acuity, get accurate diagnoses, and prescribe the eyeglasses or contacts that restore their vision to the best of our ability.
Are you overdue for an eye exam? Schedule an appointment at Eye to Eye Family Vision Care. We have all of these different types of eye charts and more at the ready. Get your world back in focus again.
